|
|
||
|---|---|---|
| .github/workflows | ||
| docs | ||
| media | ||
| src/pyladoc | ||
| tests | ||
| .flake8 | ||
| .gitignore | ||
| LICENSE | ||
| README.md | ||
| pyproject.toml | ||
README.md
Pyladoc
Description
Pyladoc is a python package for programmatically generating HTML and PDF/LaTeX output. This package targets specifically applications where reports or results with Pandas-tables and Matplotlib-figures are generated to be displayed as website and as PDF document without involving any manual formatting steps.
This package focuses on the "Document in Code" approach for cases where a lot of calculations and data handling is done but not a lot of document text needs to be displayed. The multiline string capability of Python handles this very well. In comparison to "Code in Document"-templates python tools supports this approach out of the box - similar doch docstrings.
As backend for PDF generation LaTeX is used. There are excellent engines for rendering HTML to PDF, but even if there is no requirement for an accurate typesetting and what not, placing programmatically content of variable composition and element sizes on fixed size pages without manual intervention is a hard problem where LaTeX is superior.
Example outputs
- HTML: test_html_render1.html (code)
- PDF: test_latex_render1.pdf (code)
The documents are generated by the script tests/test_rendering_example1_doc.py.
Supported primitives
- Text (can be Markdown or HTML formatted)
- Headings
- Tables (Pandas, Markdown or HTML)
- Matplotlib figures
- LaTeX equations (block or inline)
- Named references for figures, tables and equations
Key Features
- HTML and PDF/LaTeX rendering of the same document
- Single file output including figures
- Figure and equation embedding in HTML by inline SVG, SVG in Base64 or PNG in Base64
- Figure embedding in LaTeX as PGF/TikZ
- Tested on Linux and Windows
Usage Scenarios
- Webservices
- Report generation for lab equipment
Installation
It can be installed with pip:
pip install pyladoc
Dependencies
Pyladoc depends on the markdown package.
Optional dependencies are:
- Matplotlib python package for rendering LaTeX equations for HTML output
- LaTeX for exporting to PDF or exporting Matplotlib figures to LaTeX (PGF/TikZ rendering)
- Pandas and Matplotlib for including Pandas Tables and Matplotlib figures (obviously)
For the included template the following LaTeX setup works on Ubuntu:
sudo apt-get update
sudo apt-get install -y texlive-latex-extra texlive-fonts-extra lmodern texlive-xetex texlive-science
Usage
It is easy to use as the following example code shows:
import pyladoc
import pandas as pd
doc = pyladoc.DocumentWriter()
doc.add_markdown("""
# Example
This is inline LaTeX: $$\\lambda$$
This is a LaTeX block with a number:
$$
\\label{eq:test1}
\\lambda_{\text{mix}} = \\sum_{i=1}^{n} \\frac{x_i \\lambda_i}{\\sum_{j=1}^{n} x_j \\Phi_{ij}}
$$
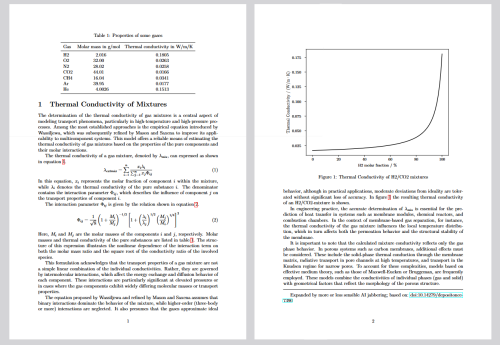
This is an example table. The table @table:pandas_example shows some random data.
""")
some_data = {
'Row1': ["Line1", "Line2", "Line3"],
'Row2': [120, 100, 110],
'Row3': ['12 g/km', '> 150 g/km', '110 g/km']
}
df = pd.DataFrame(some_data)
doc.add_table(df, 'This is a pandas example table', 'pandas_example')
html_code = doc.to_html()
print(html_code)
doc.to_pdf('test.pdf')
Contributing
Contributions are welcome, please open an issue or submit a pull request on GitHub.
Developer Guide
To get started with developing the pyladoc package, follow these steps.
First, clone the repository to your local machine using Git:
git clone https://github.com/Nonannet/pyladoc.git
cd pyladoc
It's recommended to setup an venv:
python -m venv venv
source venv/bin/activate  # On Windows use `venv\Scripts\activate`
Install the package and dev-dependencies while keeping files in the current directory:
pip install -e .[dev]
Ensure that everything is set up correctly by running the tests:
pytest
License
This project is licensed under the MIT License - see the LICENSE file for details.